

Image Details
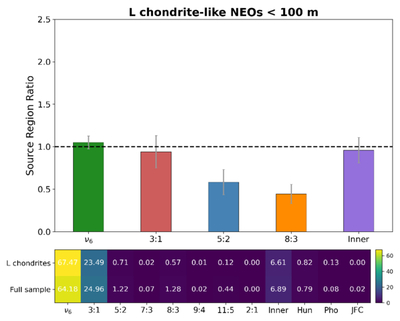
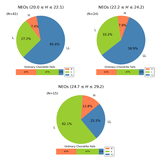
Caption: Figure 12.
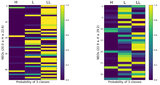
Top: source region ratios of L chondrites relative to the full sample of NEOs. For clarity, only source regions with probabilities greater than 1% in the full sample are shown. Bottom: heatmap showing the mean probability distribution functions of source regions for the full sample (lower row) and NEOs with L chondrite-like compositions (upper row).
Other Images in This Article
Show More
Copyright and Terms & Conditions
© 2026. The Author(s). Published by the American Astronomical Society.

Copyright ©
2026 Astronomy Image Explorer. All Rights Reserved.
