

Image Details
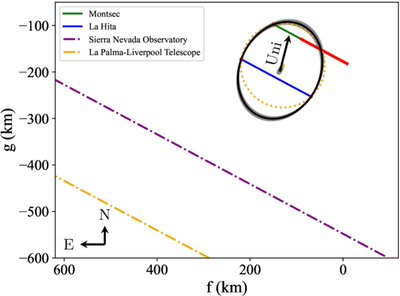
Caption: Figure 8.
Positive chords (solid green and blue) with uncertainties (solid red) and negative records (dashed–dotted purple and orange) projected at the sky plane. The origin refers to the expected satellite position (JPL#56+SPICE kernel from this work) at the closest approach instant as seen from the geocenter (2025 October 6 03:59:52.7 UT). The orange dotted circle represents the best circular profile fit, while the black ellipse shows the fitted elliptical profile with a fixed oblateness of 0.2, with the gray area delimiting the 3σ solutions. The black arrow points to the primary location at the instant of the satellite occultation.
Other Images in This Article
Copyright and Terms & Conditions
© 2026. The Author(s). Published by the American Astronomical Society.

