

Image Details
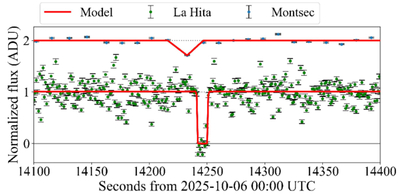
Caption: Figure 7.
Normalized stellar flux ratio with uncertainties as measured from each station, as a function of time. The red solid lines represent the positive light-curve models used to obtain the Tinia immersion and emersion instants. The La Hita light curve was displaced by unity for visualization purposes.
Other Images in This Article
Copyright and Terms & Conditions
© 2026. The Author(s). Published by the American Astronomical Society.

Copyright ©
2026 Astronomy Image Explorer. All Rights Reserved.
