

Image Details
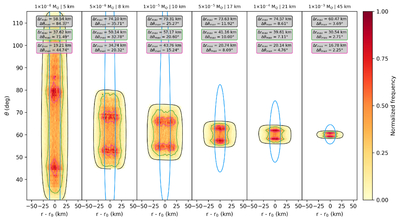
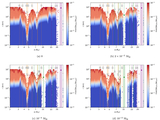
Caption: Figure 6.
Frequency maps of test particles in the vicinity of one of the triangular equilibrium points of a satellite placed at 5676.5 km from Quaoar, with the satellite mass indicated at the top of each panel. We consider masses ranging from 10−6 to 10−3 MQ, corresponding to satellite radii of approximately 4–45 km. The radial origin of each map is defined by the median radial distance of the particles, r0. The color scale represents the normalized particle frequency. Black, green, and magenta contour lines delineate regions where the normalized frequency exceeds 0, 0.3, and 0.75, respectively. For each contour level, the gray boxes indicate the maximum extent of the particle distribution, quantified by ﹩{\rm{\Delta }}{r}_{{\rm{\max }}}﹩ and ﹩{\rm{\Delta }}{\theta }_{{\rm{\max }}}﹩. Blue curves correspond to zero-velocity curves in the restricted three-body problem that reproduce the radial width of the putative arc.
Other Images in This Article
Copyright and Terms & Conditions
© 2026. The Author(s). Published by the American Astronomical Society.

