

Image Details
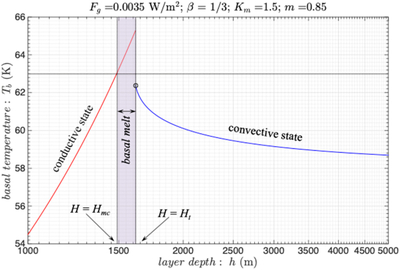
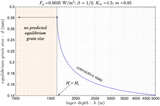
Caption: Figure C1.
A model depicting the basal temperature Tb as a function of layer depth H for input parameter values shown. These solutions are based on the procedure outlined in Appendix C. The equilibrium basal temperature is shown in blue for convecting ice. The shaded region indicates the basal melt regime. Ht indicates the transition depth below which there exists no predicted equilibrium grain size d. Under such situations the grains inexorably grow causing an increase in the material viscosity stiffening the ice, which will eventually terminate convection in the layer. The result will be a static layer exhibiting a conductive temperature profile (shown in red). The values we use for parameters m and Km are for pyroxene (I. Shimizu 1998).
Other Images in This Article
Show More
Copyright and Terms & Conditions
© 2026. The Author(s). Published by the American Astronomical Society.

