

Image Details
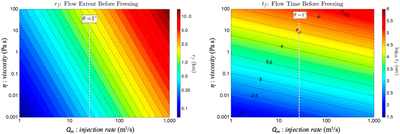
Caption: Figure 3.
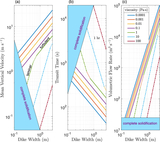
Flow over the ice sheet surface before freezing halts movement. Created using known and conjectured thermophysical properties of solid and liquid N2 (Table 1) as input values with local slope θ = 1°. Left panel: radial flow distance rf before freezing. Right panel: duration of flow before freezing tf. Vertical dashed lines correspond to a reference discharge rate Qm = 25 m3 s−1 (see discussion, in Section 4.5). Freezing times shown in this figure range from ~0.02 to 200 hr depending on viscosity and injection rate of the flow. We use η for the dynamic viscosity of solid N2 ice, distinguishing it from the dynamic viscosity μ of liquid N2.
Other Images in This Article
Show More
Copyright and Terms & Conditions
© 2026. The Author(s). Published by the American Astronomical Society.

