Image Details
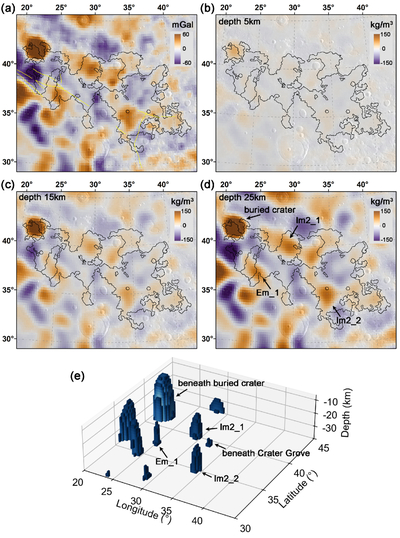
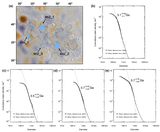
Caption: Figure 4.
The Bouguer gravity anomaly and the subsurface structures for Lacus Somniorum. (a) Bouguer gravity anomaly; yellow lines represent the mapped graben traces (C. Fortezzo et al. 2020). (b)–(d) The horizontal density anomaly slices for the subsurface structures at depths of (b) 5, (c) 15, and (d) 25 km. (e) 3D distribution of density anomalies (>100 kg m−3). The black lines in panels (a) to (d) indicate the boundaries of maria and plains units. The black arrows in panel (e) indicate the high-density masses beneath the corresponding geological units.
Other Images in This Article
Copyright and Terms & Conditions
© 2026. The Author(s). Published by the American Astronomical Society.
Copyright ©
2026 Astronomy Image Explorer. All Rights Reserved.