Image Details
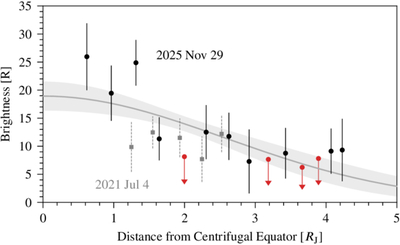
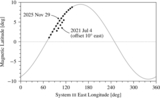
Caption: Figure 5.
Change in Callisto’s 630.0 nm [O I] emission with distance from the plasma sheet centrifugal equator. Scatter points with error bars show the brightness and uncertainty calculated from individual 5 minute integrations on 2021 July 04 (gray) and 2025 November 29 (black). Scatter points with downward-pointing arrows (red) are the 2σ upper limits for nondetections. The solid gray line and shaded light gray region shows the best fit of Equation (1) to the 2025 November 29 data.
Other Images in This Article
Copyright and Terms & Conditions
© 2026. The Author(s). Published by the American Astronomical Society.
Copyright ©
2026 Astronomy Image Explorer. All Rights Reserved.