Image Details
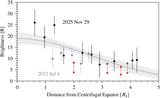
Caption: Figure 3.
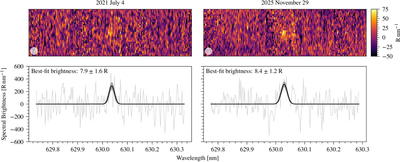
Callisto’s 630.0 nm [O I] emission on 2021 July 04 (left column) and 2025 November 29 (right column). The two plots in the top row show the two-dimensional calibrated average spectra over the 14″ slit length with scattered light from Jupiter and the 630.0 nm [O I] telluric emission line subtracted. The two plots in the bottom row show one-dimensional spectra summed over a 2″aperture (light gray lines) along with best-fit Gaussian functions (solid black lines) and their corresponding uncertainties (gray shaded regions). White circles in the lower left of the top panels show the relative size of Callisto’s disk. Larger residuals occur where we have subtracted telluric emission lines, which is especially evident to the left of the Callisto emission in the top plot of 2025 November 29. The annotation in the upper left of the bottom panels is the total brightness (assuming emission from Callisto’s disk).
(The data used to create this figure are available in the online article.)
(The data used to create this figure are available.)
Other Images in This Article
Copyright and Terms & Conditions
© 2026. The Author(s). Published by the American Astronomical Society.