

Image Details
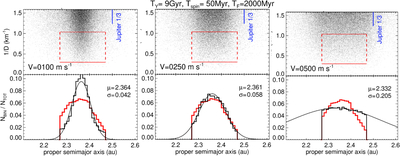
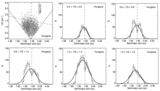
Caption: Figure A3.
Vesta model dependence on the fragment separation velocity ﹩v﹩. Each pair of panels shows the ﹩1/D-﹩ ﹩a﹩ distribution of model particles (top), the histogram of model data (thick black line; bottom) taken from the test region (red rectangle), and the Gaussian fit (thin black line). The red line is the histogram of family data in the test region. Model parameter values are shown in the header. Note the similarity between model and family for v = 250 m s−1 (middle panels). The displayed mean ﹩\mu ﹩ and standard deviation ﹩\sigma ﹩ are those of the fitted Gaussian distributions.
Other Images in This Article
Show More
Copyright and Terms & Conditions
© 2026. The Author(s). Published by the American Astronomical Society.

Copyright ©
2026 Astronomy Image Explorer. All Rights Reserved.
