

Image Details
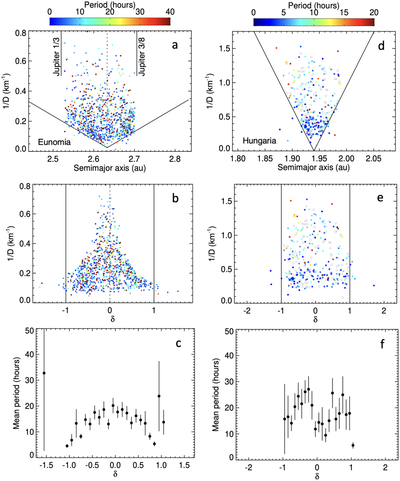
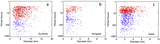
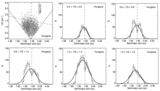
Caption: Figure 7.
Panel (a): Eunomia family scatter plot, with asteroids colored based on their rotation periods. Panel (b): similar to panel (a) but in ﹩\delta -1/D﹩ space. Panel (c): variation of the mean period as a function of δ. Each data point corresponds to a Δδ = 0.1 bin. Panels (d), (e), and (f): as in (a), (b), and (c) but for the Hungaria family. Open points in panels (d) and (e) are asteroids with >20 hr periods.
Other Images in This Article
Show More
Copyright and Terms & Conditions
© 2026. The Author(s). Published by the American Astronomical Society.

Copyright ©
2026 Astronomy Image Explorer. All Rights Reserved.
