

Image Details
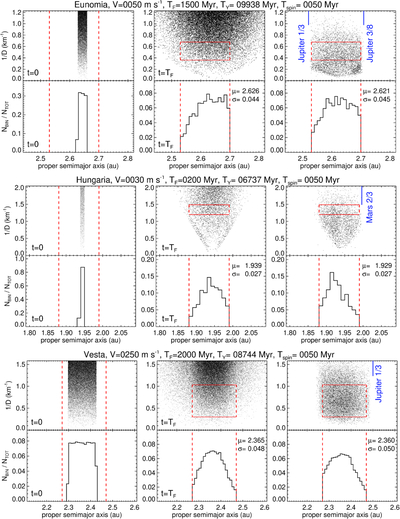
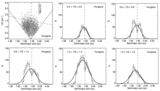
Caption: Figure A2.
Model distributions of ﹩1/D﹩ - ﹩a﹩ and histograms similar to those in Figure 1 from our simulations of asteroid random walk evolution within the Eunomia (top), Hungaria (middle), and Vesta (bottom) families at ﹩t=0﹩ (left) and ﹩t={T}_{F}﹩ (middle) compared to the observed family distributions (right). Panel headers show the fragment separation velocity ﹩v﹩, family age ﹩{T}_{F}﹩, Yarkovsky timescale TY (1 km), and spin reorientation timescale ﹩{T}_{\mathrm{spin}}﹩ (1 km) for each simulation. Values of other model parameters are listed in Tables 3 and A1. The red vertical dashed lines indicate the width of the test region (see text) in semimajor axis.
Other Images in This Article
Show More
Copyright and Terms & Conditions
© 2026. The Author(s). Published by the American Astronomical Society.

