

Image Details
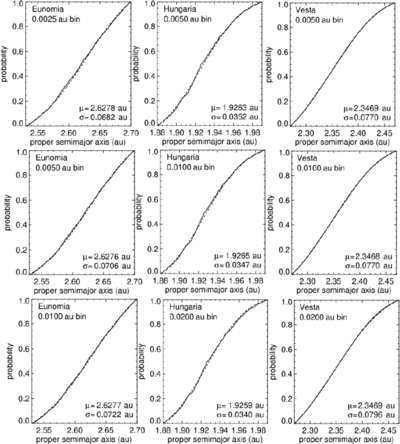
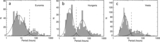
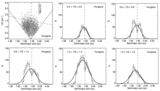
Caption: Figure A1.
Empirical distribution functions (solid lines) of the family data used in our Gaussian fits compared to the fitted distributions (Equation (A2); dashed lines). Middle row panels correspond to the fits shown in Figure 1 with parameter values and K-S similarity test results listed in Table A1.
Other Images in This Article
Show More
Copyright and Terms & Conditions
© 2026. The Author(s). Published by the American Astronomical Society.

Copyright ©
2026 Astronomy Image Explorer. All Rights Reserved.
