Image Details
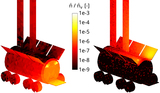
Caption: Figure 10.
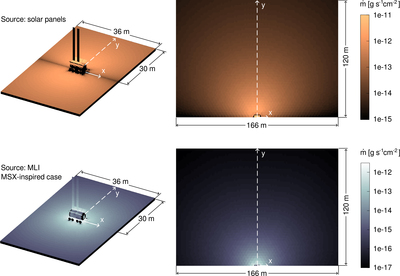
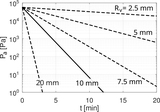
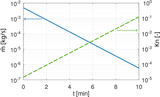
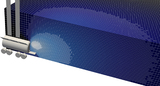
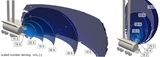
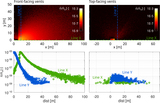
Outgassing simulations. Deposition rates in the vicinity of the module (left) and at a distance (right). Top: contamination from the solar panels, emitting at ﹩\dot{m}=1{0}^{-10}\,{\rm{g}}\,{{\rm{cm}}}^{-2}\,{{\rm{s}}}^{-1}﹩. Bottom: contamination from the MLI for an MSX/Rosetta-like emission rate of ﹩\dot{m}=3\times 1{0}^{-12}\,{\rm{g}}\,{{\rm{cm}}}^{-2}\,{{\rm{s}}}^{-1}﹩. The case of the larger MLI outgassing rate is analogous, except that the results are 4 orders of magnitude larger. The deposition rates extracted along the white dashed line are shown in Figure 11.
Other Images in This Article
Show More
Copyright and Terms & Conditions
© 2026. The Author(s). Published by the American Astronomical Society.
Copyright ©
2026 Astronomy Image Explorer. All Rights Reserved.