Image Details
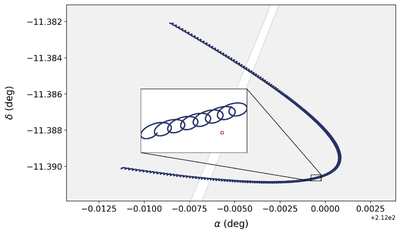
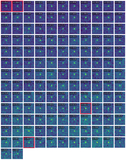
Caption: Figure 6.
Trajectory of 2003 BF91 on the sky as seen by HST over the course of the survey. The inset plot emphasizes how nonlinear the trajectory is, due to HST’s low-Earth orbit; the proper motion in the sky plane remains linear for at most a few minutes at a time. The red square shows the size of 1 pixel; it is clear that the parallax loops are too large to simply ignore. The heliostack algorithm automatically corrects for this parallax. The gray regions represent the locations of different CCDs, showing that we are able to find objects that cross detectors over the course of the survey.
Other Images in This Article
Copyright and Terms & Conditions
© 2026. The Author(s). Published by the American Astronomical Society.
Copyright ©
2026 Astronomy Image Explorer. All Rights Reserved.