Image Details
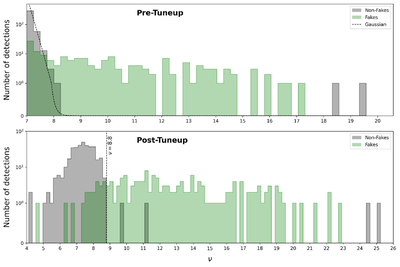
Caption: Figure 2.
Top: distribution of the signal-to-noise ratio of all of the unique candidate trajectories resulting from the heliostack search, with ν ≥ 7. The green histogram represents the implanted synthetic sources, and the gray histogram represents real candidate moving objects. The dashed black line shows the shape of a Gaussian distribution with a mean of zero and a width of one. It is clear that the distribution of ν is very nearly Gaussian. Bottom: distribution of the signal-to-noise ratio of all of the unique candidate trajectories after the tune-up step described in Section 3.4. Real candidates tend to increase in significance, while spurious candidates tend not to. There is a clear boundary at ν = 8.8, beyond which there are probably no false positives.
Other Images in This Article
Copyright and Terms & Conditions
© 2026. The Author(s). Published by the American Astronomical Society.