Image Details
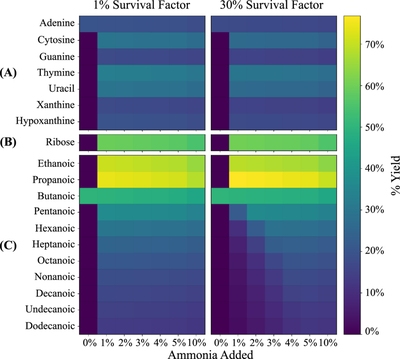
Caption: Figure B1.
Heat maps of percent yields (applicable to aqueous environments spanning 0°C–100°C) relative to the starting limiting reagent, for (A) nucleobases, (B) ribose, and (C) C2–C12 fatty acids with 1% and 30% survival factors for the initial organic inventory. Columns correspond to varying NH3 concentrations (relative to total water content). Rows list the individual molecules in each class. Cell shading follows a common viridis color scale, ranging from 0% (purple) to >70% (yellow) yield.
Other Images in This Article
Copyright and Terms & Conditions
© 2026. The Author(s). Published by the American Astronomical Society.
Copyright ©
2026 Astronomy Image Explorer. All Rights Reserved.