Image Details
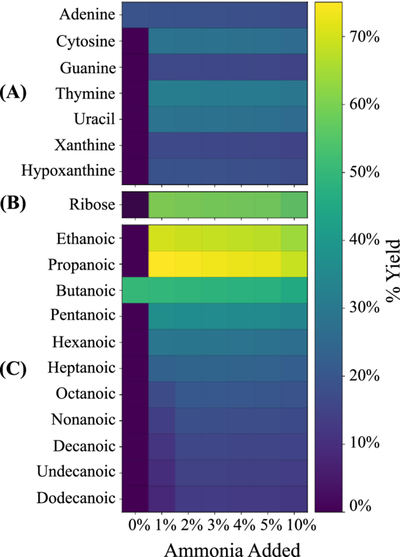
Caption: Figure 2.
Heat maps of percent yields (applicable to aqueous environments at thermodynamic equilibrium spanning 0°C–100°C) relative to the starting limiting reagent, for (A) nucleobases, (B) ribose, and (C) C2–C12 fatty acids in our fiducial models. Columns correspond to varying NH3 concentrations (relative to total water content), and rows list the individual molecules in each class. Cell shading follows a common viridis color scale, ranging from 0% (purple) to >70% (yellow) yield.
Other Images in This Article
Copyright and Terms & Conditions
© 2026. The Author(s). Published by the American Astronomical Society.
Copyright ©
2026 Astronomy Image Explorer. All Rights Reserved.