Image Details
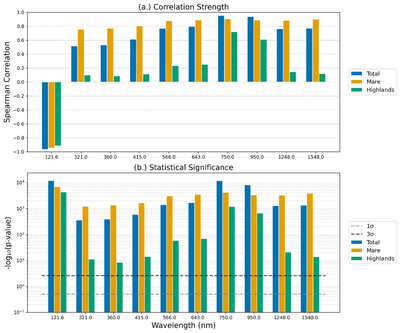
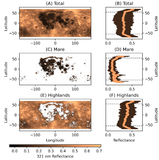
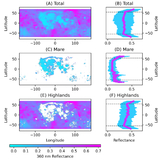
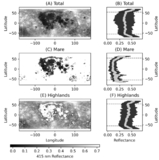
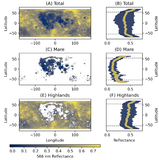
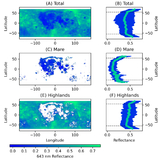
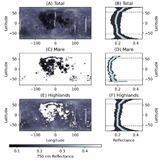
Caption: Figure 14.
(a) Spearman correlation coefficient strength as a function of wavelength for the total (global), maria, and highlands trends. The maria show a consistent correlation at all wavelengths of reflectance with latitude. The highlands show a variable strength correlation of reflectance with latitude, with the strongest correlation in FUV. (b) Statistical significance of correlation as a function of wavelength for the total (global), maria, and highlands trends. Data are shown in log scale. All regions show greater than 3σ significance.
Other Images in This Article
Show More
Copyright and Terms & Conditions
© 2026. The Author(s). Published by the American Astronomical Society.
Copyright ©
2026 Astronomy Image Explorer. All Rights Reserved.