Image Details
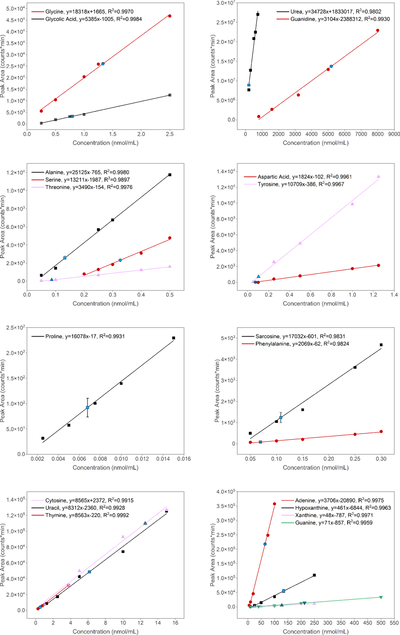
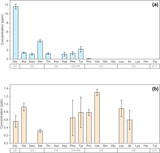
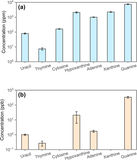
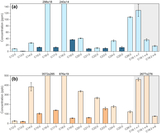
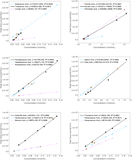
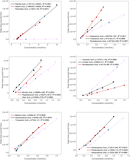
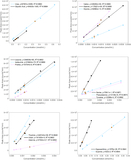
Caption: Figure A1.
Calibration curves for the 10 amino acids, 7 nucleobases, and 3 other biomolecules detected in the Titan aerosol analog, with blue symbols representing data points obtained from the Titan aerosol analog sample. Calibration points were selected to match the corresponding signal intensities, resulting in substantially different concentration ranges among compounds in Figures A1–A4. Note that the concentration values were converted to represent the concentrations of biomolecules in the original sample solutions (Figures A1 and A2 correspond to the Titan aerosol analog, while Figures A3 and A4 correspond to the Martian analog sample).
Other Images in This Article
Copyright and Terms & Conditions
© 2026. The Author(s). Published by the American Astronomical Society.