Image Details
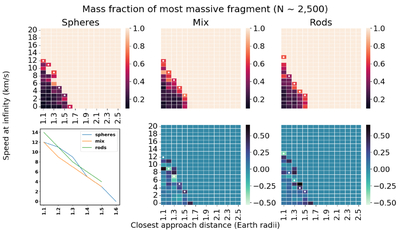
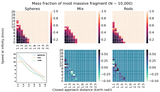
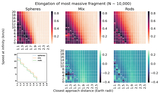
Caption: Figure 4.
The top row shows heat maps of the primary fragment mass fraction for trials S1, M1, and R1, from left to right. The bottom two heat map panels show the discrepancy in mass fraction between M1 and S1 and R1 and S1, respectively. Positive numbers indicate a larger primary fragment mass fraction than in the spherical case. The white circles represent the beginning of the “disruption region.” Finally, the line plot shows the location of the 15% disruption limit (white dots in heat maps) for the different particle shapes. See Section 3.1 for a more detailed explanation.
Other Images in This Article

Show More
Copyright and Terms & Conditions
© 2026. The Author(s). Published by the American Astronomical Society.
Copyright ©
2026 Astronomy Image Explorer. All Rights Reserved.