Image Details
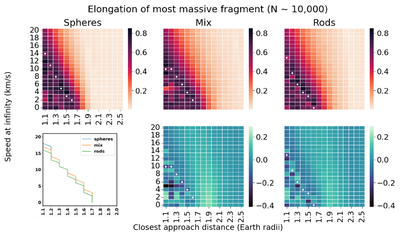
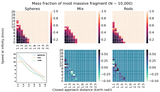
Caption: Figure 10.
Heat maps of primary fragment elongation for trials S2, M2, and R2. The line plot shows the locations where the elongation of the fragments reaches 0.5, moving from right to left across the top three heat map plots.
Other Images in This Article


Show More
Copyright and Terms & Conditions
© 2026. The Author(s). Published by the American Astronomical Society.
Copyright ©
2026 Astronomy Image Explorer. All Rights Reserved.