Image Details
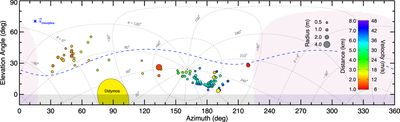
Caption: Figure 9.
Plot showing the azimuth/elevation angle trajectories derived for the 104 boulders measured in this study (showing their locations in the sky if viewed from the impact site). Most of the objects are clustered in two groups, with only a few others scattered in between. Those in the larger cluster to the south were ejected on trajectories only 4°–25° above the horizon. The points are sized to denote the boulders’ radii and color-coded to show their distances from Dimorphos. (Closer boulders are plotted on top, so in crowded areas more distant objects may be hidden by closer ones.) The pink tinted region denotes the exclusion zone, where any boulders that might be present would not be seen because they were outside of the images when the spacecraft was close enough to detect them. The yellow ellipsoid represents the projection of Didymos, and the shaded bar at the bottom shows the region below the horizon. The dashed blue line represents the projection of the walls of the dust ejecta cone. Equatorial coordinates for the celestial sphere are plotted for reference. The asterisk in the upper left corner indicates the direction of Dimorphos’s velocity (linear momentum) vector, the direction defining the effective β value.
Other Images in This Article
Show More
Copyright and Terms & Conditions
© 2025. The Author(s). Published by the American Astronomical Society.