

Image Details
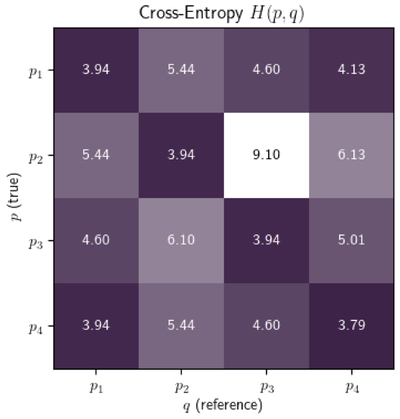
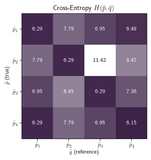
Caption: Figure A2.
Continuous cross-entropy matrix H(p, q) computed using the closed-form expression of Equation (A3). Rows correspond to the true distribution p, and the columns correspond to the reference distribution q. Diagonal elements represent the entropies H(p) of each distribution, while off-diagonal terms quantify dissimilarity between distributions. Larger values indicate greater divergence in mean or covariance structure. The dominant entropy occurs for the pair (p2, p3), reflecting that a mean-shifted Gaussian is poorly described by an anisotropic Gaussian with a different covariance structure, while distributions sharing similar structure exhibit comparatively smaller cross entropies.
Other Images in This Article
Copyright and Terms & Conditions
© 2026. The Author(s). Published by the American Astronomical Society.

