

Image Details
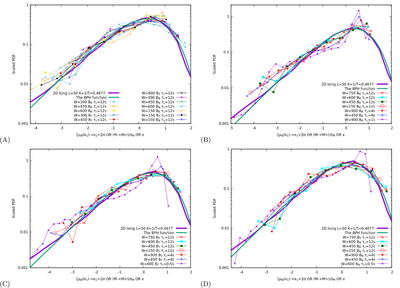
Caption: Figure 4.
(a) The scaled distribution of μW(κ1) for W = 600, 450, 300, and 150 for BR, BT, and BN for τc = 12 s. The continuous purple line corresponds to the scaled distribution of the magnetization of a 2D Ising model of linear dimension L = 50 below its critical temperature Tc with inverse temperature parameter K = 0.4677 (Kc = 0.4407, see K. Huang 1987) while the so-called (B. P. van Milligen et al. 2005) BHP function (see Equation (6)) can be also visualized in green. (b) The same as in (a) but for BR only with additional values of W and τc. (c), (d) The same as (b) but for BT, and BN, respectively.
Other Images in This Article
Copyright and Terms & Conditions
© 2026. The Author(s). Published by the American Astronomical Society.

Copyright ©
2026 Astronomy Image Explorer. All Rights Reserved.
