

Image Details
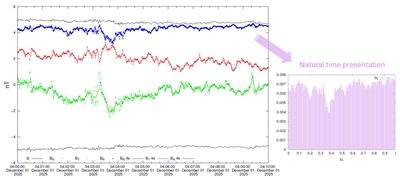
Caption: Figure 3.
How a time series of BR (blue) in conventional (clock) time can be visualized in natural time (right panel). The left panel shows 2 Hz IMF components (colored circles) and magnitude (black line) during the period 04:00:00 to 04:10:00 UTC on 2025 December 1, together with their averaged values (continuous lines of darker color) with cadence τc = 4 s. The latter measurements are used for the estimation of the distribution of pk of NTA which is shown in the right panel. Here, N = 150 corresponding to 10 minutes with a cadence of 4 s.
Other Images in This Article
Copyright and Terms & Conditions
© 2026. The Author(s). Published by the American Astronomical Society.

Copyright ©
2026 Astronomy Image Explorer. All Rights Reserved.
