

Image Details
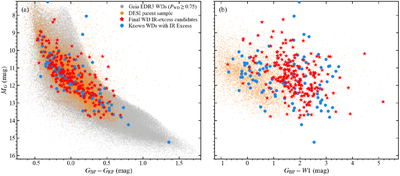
Caption: Figure 7.
Color–magnitude diagrams of the final IR-excess WD candidates, shown together with the DESI parent sample, Gaia EDR3 WD candidates, and previously reported WD IR-excess systems or candidates. Panel (a) shows MG versus the optical color GBP − GRP, and panel (b) shows MG versus the optical-to-infrared color GBP − W1.
Other Images in This Article
Copyright and Terms & Conditions
© 2026. The Author(s). Published by the American Astronomical Society.

Copyright ©
2026 Astronomy Image Explorer. All Rights Reserved.
