

Image Details
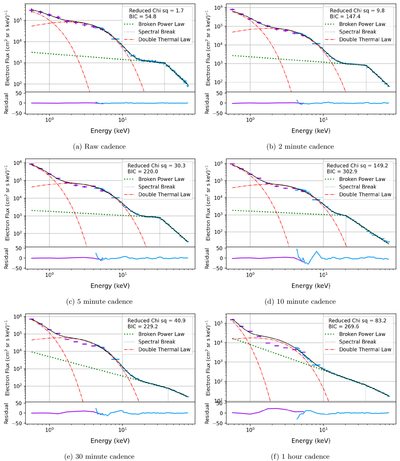
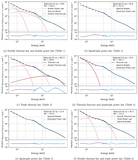
Caption: Figure 7.
Showing the effect of resampling on the fit of the double thermal function and double power-law function. Each panel shows a peak-flux spectrum generated from time series of a different cadence. The total fit is shown in black, with the spectral components added as shown in the legend. These fits have their respective residuals shown below to further illustrate fit quality. The parameters of these fits are given in Table 7.
Other Images in This Article
Copyright and Terms & Conditions
© 2026. The Author(s). Published by the American Astronomical Society.

Copyright ©
2026 Astronomy Image Explorer. All Rights Reserved.
