

Image Details
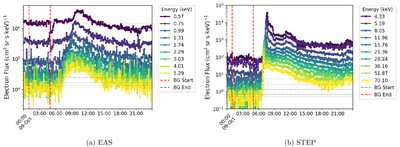
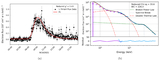
Caption: Figure 2.
EAS (a) and STEP (b) time series resampled to 5 minute cadence, with the background period shown in red and the background intensity levels calculated as an average over the full background period shown in gray.
Other Images in This Article
Copyright and Terms & Conditions
© 2026. The Author(s). Published by the American Astronomical Society.

Copyright ©
2026 Astronomy Image Explorer. All Rights Reserved.
