

Image Details
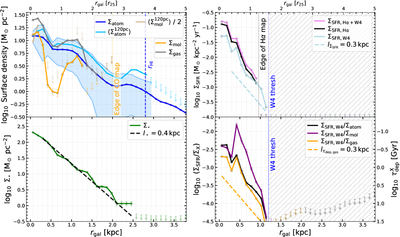
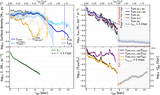
Caption: Figure 2.
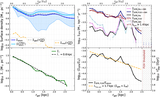
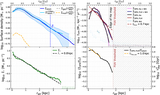
Azimuthally averaged surface density profiles for IC 10. The x-axes show galactocentric radius in physical units and normalized to the optical isophotal radius (r25). Upper left: gas surface densities. Blue colors show the atomic-gas surface density Σatom (Equation (A1)) including the 16%–84% range as a shaded blue region. The vertical, blue-dashed line denotes rHI, the radius where Σatom = 1 M⊙ pc−2. In light blue colors, we show the profile of the mass-weighted atomic-gas surface density ﹩\langle {{\rm{\Sigma }}}_{{\rm{atom}}}^{{\rm{120pc}}}\rangle ﹩ (Equation (A2)), where upper limits show radial bins that did not satisfy our 50% completion criterion. The difference between the two profiles shows how clumpy the atomic gas is. Upper limits in all the other profiles denote nondetection or beyond where their cumulative profiles converge (see Table 5 and Table 7), which we highlight in the SFR profiles as vertical threshold lines. Where available, we show profiles of the molecular gas surface density Σmol (Equation (A4)), the mass-weighted molecular gas surface density ﹩\langle {{\rm{\Sigma }}}_{{\rm{mol}}}^{{\rm{120pc}}}\rangle ﹩, and the total gas surface density Σgas. Lower left: the stellar-mass surface density Σ⋆ with mass-to-light ratios taken from Table 5 (Equation (A12)). Upper right: ΣSFR, from Hα+W4, FUV+W4 (22 μm), Hα, FUV, and W4 (22 μm) where available. Lower right: ratios of ΣSFR to Σatom, Σmol, and Σgas, i.e., the star formation efficiency of atomic, molecular, and total neutral gas. The second y-axis shows the corresponding gas depletion times, ﹩{\tau }_{{\rm{dep}}}^{{\rm{atom}}}﹩, ﹩{\tau }_{{\rm{dep}}}^{{\rm{mol}}}﹩, ﹩{\tau }_{{\rm{dep}}}^{{\rm{gas}}}﹩ (Equation (1)). We show fits for the scale lengths of stellar mass, star formation activity, and the gas depletion time (Table 4).
Other Images in This Article
Show More
Copyright and Terms & Conditions
© 2026. The Author(s). Published by the American Astronomical Society.

