

Image Details
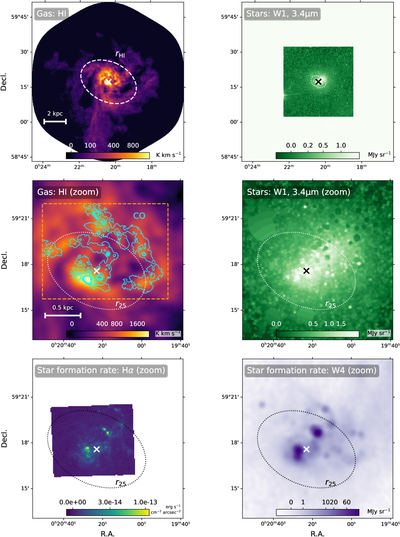
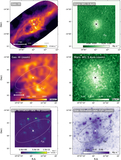
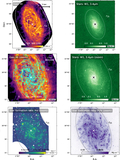
Caption: Figure 1.
An atlas of gas, stars, and star formation for IC 10. The upper two maps show field of views matched to the H I map. The lower four panels show zoomed-in versions to better illustrate the connection to the other tracers. The white-dashed circle shows the rHI taken from Table 3, and the dotted circle indicates the optical radius r25 taken from Table 1. The orange-dashed lines show the field of view (FoV) of CO observations. Color bars show intensities in units of K km s−1 for H I, MJy sr−1 for W1 and FUV, and erg s−1 cm−2 arcsec−2 for Hα.
Other Images in This Article
Show More
Copyright and Terms & Conditions
© 2026. The Author(s). Published by the American Astronomical Society.

Copyright ©
2026 Astronomy Image Explorer. All Rights Reserved.
