

Image Details
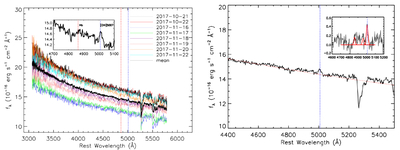
Caption: Figure 5.
The eight spectra observed in the period of 2017 October 21–2017 November 22 and the flux-averaged spectrum (left). All spectra were corrected for Galactic extinction and shifted to source rest frame, with the position of emission lines of Hβ and [O III] λ5007 Å indicated as the vertical red dotted and green dotted lines. The spectral fitting of OJ 287 (right), where the continuum is fitted with a single power law shown as the red dotted line; the black line is the original flux-averaged spectrum and the inset shows the line fitting for [O III] λ5007 Å.
Other Images in This Article
Copyright and Terms & Conditions
© 2026. The Author(s). Published by the American Astronomical Society.

Copyright ©
2026 Astronomy Image Explorer. All Rights Reserved.
