

Image Details
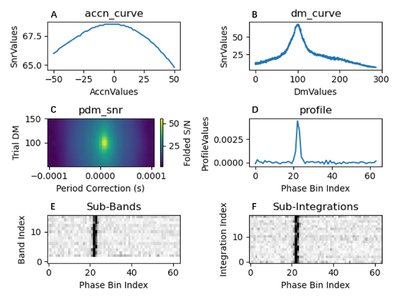
Caption: Figure 1.
Pulsar candidate diagnostic plots: “accn_curve” shows the signal-to-noise ratio as a function of acceleration, “dm_curve” illustrates changes in signal-to-noise across dispersion measure values, “pdm_snr” visualizes the folded signal-to-noise ratio across trial period corrections and DM values, “profile” displays the pulse shape of the candidate, “sub-bands” reveals frequency-dependent signal variations, and “subintegrations” demonstrates time-dependent signal fluctuations.
Other Images in This Article
Copyright and Terms & Conditions
© 2026. The Author(s). Published by the American Astronomical Society.

Copyright ©
2026 Astronomy Image Explorer. All Rights Reserved.
