

Image Details
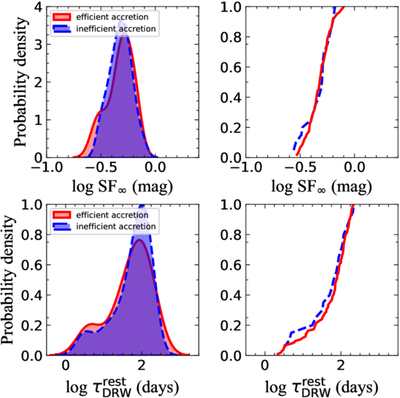
Caption: Figure 2.
The distributions of damping timescales and variability amplitudes for radio-quiet AGNs with efficient and inefficient accretion are presented. Top panels: distribution of variability amplitude (SF∞; left) and its cumulative distribution (right). Bottom panels: corresponding distributions for the characteristic timescale of variability. The red solid line represents radio-quiet AGNs with efficient accretion, while the blue dashed line denotes radio-quiet AGNs with inefficient accretion.
Other Images in This Article
Copyright and Terms & Conditions
© 2026. The Author(s). Published by the American Astronomical Society.

Copyright ©
2026 Astronomy Image Explorer. All Rights Reserved.
