

Image Details
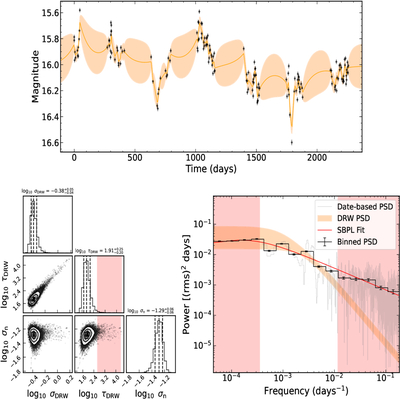
Caption: Figure 1.
An illustration of modeling the zg-band light curve of J1139.0-2323 using the damped random walk (DRW) model, implemented via the efficient Gaussian process method celerite. The upper panel displays the observed light curve alongside the DRW model prediction derived from the best-fit maximum likelihood parameters. The orange curve represents the optimal DRW fit, with the surrounding shaded region indicating the 1σ confidence interval. In the lower-left panel, posterior distributions of the inferred DRW parameters are presented. The lower-right panel depicts both the normalized power spectral density (PSD) and its binned version, including 1σ error ranges. The orange envelope corresponds to the theoretical PSD of the DRW model with associated uncertainties. The gray line illustrates the Lomb–Scargle periodogram, whereas the black line shows the binned version of this periodogram. A broken power-law function was fitted to the binned Lomb–Scargle results, represented by the red curve. The pink-shaded areas highlight timescales exceeding 20% of the total observational baseline (shown in both lower panels) and those shorter than the average sampling interval (indicated in the lower-right panel). Differences between the empirical Lomb–Scargle periodogram and the modeled PSD likely arise from several sources: difficulties in reliably estimating PSDs from unevenly spaced time series using Fourier techniques, the impact of photometric measurement errors on spectral estimation, and possible deviations of the actual variability from the assumed DRW framework (Z. Stone et al. 2022).
Other Images in This Article
Copyright and Terms & Conditions
© 2026. The Author(s). Published by the American Astronomical Society.

