

Image Details
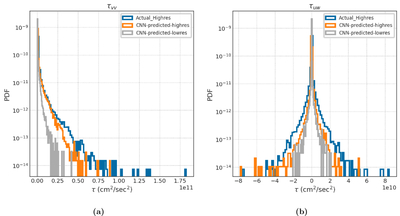
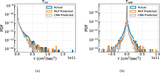
Caption: Figure 13.
Distributions of components τvv shown in panel (a) and τuw in panel (b). Blue curves show the original target distributions, orange curves show CNN predictions using filtered/coarse-grained inputs derived from the high-resolution simulations, and gray curves show CNN predictions using inputs from the genuine low-resolution simulations for the case CS = CC = 0.001.
Other Images in This Article
Show More
Copyright and Terms & Conditions
© 2026. The Author(s). Published by the American Astronomical Society.

Copyright ©
2026 Astronomy Image Explorer. All Rights Reserved.
