Image Details
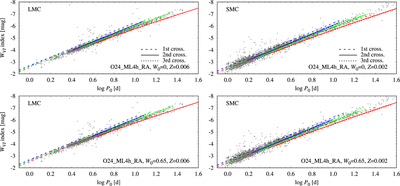
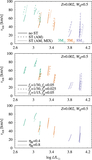
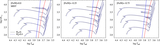
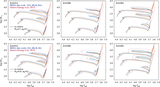
Caption: Figure 6.
Comparison of the observed and model P–L relations expressed in terms of the Wesenheit index, WVI = I − 1.55(V − I), for the LMC (left) and SMC (right). OGLE data (I. Soszyński et al. 2015, 2017, 2019) are compared to Z = 0.006 (LMC) and Z = 0.002 (SMC) models of the O24_ML4h_RA set without rotation (top) and including rotation (W0 = 0.65, bottom). Model relations are shown for the blue and red edges and midline of the IS, with blue, red, and green colors, respectively. Relations for different crossings are plotted with different line styles, as indicated in the legend (relations for the second and third crossings largely overlap). Adopted distance moduli are from G. Pietrzyński et al. (2019) for the LMC and from D. Graczyk et al. (2020) for the SMC.
Other Images in This Article
Show More
Copyright and Terms & Conditions
© 2026. The Author(s). Published by the American Astronomical Society.