Image Details
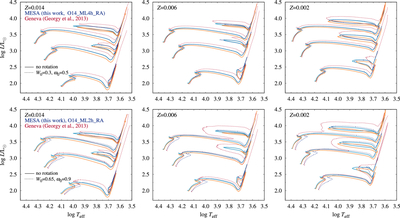
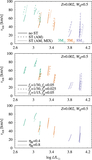
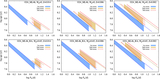
Caption: Figure 10.
Comparison of MESA tracks computed in this study (O14_ML4h_RA; blue lines) with models computed with the Geneva code (C. Georgy et al. 2013) from the SYCLIST database (orange lines). The 3, 5, and 7 M⊙ models are presented with Z = 0.014 (left), Z = 0.006 (middle), and Z = 0.002 (right). Nonrotating models are plotted with solid lines and light color. Models including rotation are plotted with dotted lines and dark color. The initial rotation rates are W0 = 0.3 and ω0 = 0.5 in the top panels, and W0 = 0.65 and ω0 = 0.9 in the bottom panels.
Other Images in This Article
Show More
Copyright and Terms & Conditions
© 2026. The Author(s). Published by the American Astronomical Society.
Copyright ©
2026 Astronomy Image Explorer. All Rights Reserved.