Image Details
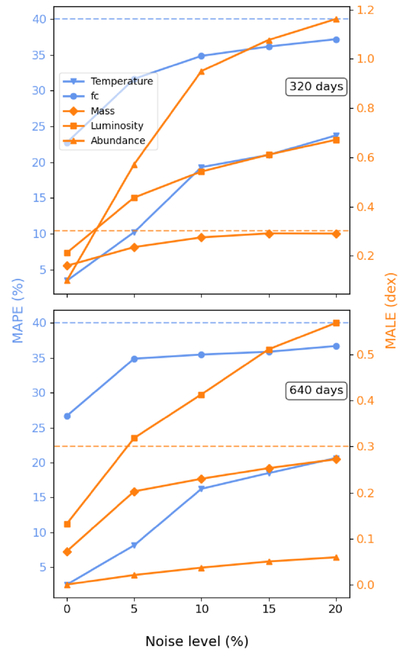
Caption: Figure 3.
MAPE (left blue axis) and MALE (right orange axis) variables with increasing simulated noise at 320 (upper plot) and 640 days (bottom plot). The dashed lines represent 40% (blue) and 0.3 dex (orange) uncertainties.
Other Images in This Article
Copyright and Terms & Conditions
© 2026. The Author(s). Published by the American Astronomical Society.
Copyright ©
2026 Astronomy Image Explorer. All Rights Reserved.