Image Details
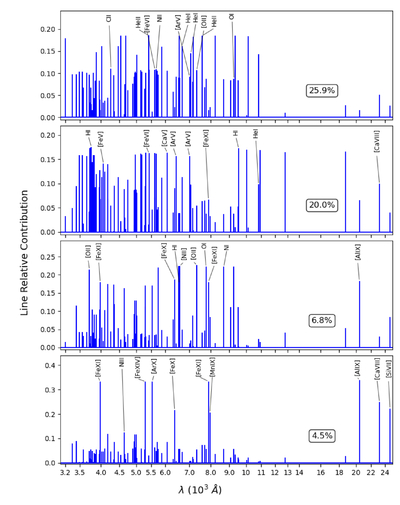
Caption: Figure 1.
Line relative contribution to variance of, from top to bottom, the higher representative eigenspectra 1 and 2, and lower eigenspectra 5 and 7, at 320 days posteruption using the epoch selection, with their respective variance explained as percentages. The black tags label the top line ratio of the five most important ions in the visible (<7000 Å) and the five most important ions in the NIR (>7000 Å), ranked by their contribution in each case. The wavelength axis in log scale.
Other Images in This Article
Copyright and Terms & Conditions
© 2026. The Author(s). Published by the American Astronomical Society.
Copyright ©
2026 Astronomy Image Explorer. All Rights Reserved.