Image Details

Caption: Figure 7.
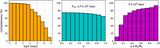
Top: color–magnitude diagram of the Hyades from Gaia photometry, for all members (“M”) and possible members (“M?”) in our sample. Also shown is the model isochrone for the cluster we use throughout this paper, including color corrections as prescribed by F. Wang et al. (2025). Bottom: Distribution of stellar masses for objects in the top panel with sufficient information to make an estimate. For binary and multiple systems, the value shown is for the primary component (see Table 2).
Other Images in This Article
Show More
Copyright and Terms & Conditions
© 2026. The Author(s). Published by the American Astronomical Society.
Copyright ©
2026 Astronomy Image Explorer. All Rights Reserved.