Image Details
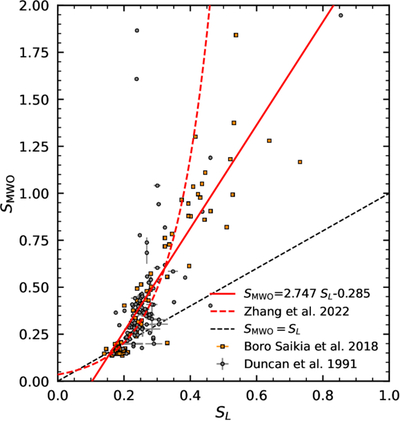
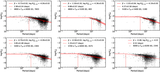
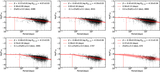
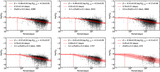
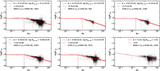
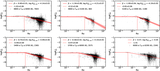
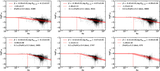
Caption: Figure 12.
The distribution of SL values derived from LAMOST spectra with the SMWO values reported in previous studies. The black dotted line indicates SMWO = SL, while the red solid line indicates the best-fit relationship between the two indices.
Other Images in This Article
Show More
Copyright and Terms & Conditions
© 2026. The Author(s). Published by the American Astronomical Society.
Copyright ©
2026 Astronomy Image Explorer. All Rights Reserved.