Image Details
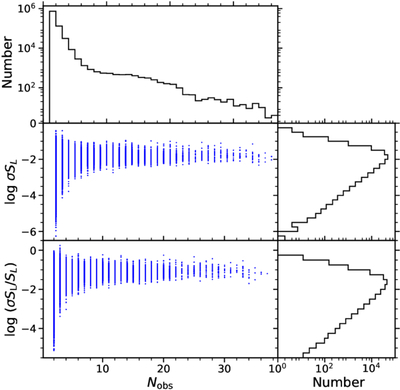
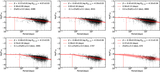
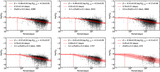
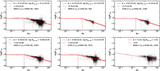
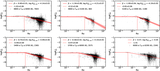
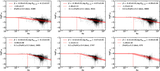
Caption: Figure 1.
Distribution of ﹩\mathrm{log}\,\sigma {S}_{L}﹩ and ﹩\mathrm{log}\,(\sigma {S}_{L}/{S}_{L})﹩ versus the number of observations. The top panel presents the histogram of observation counts, while the right panels display the corresponding distributions of ﹩\mathrm{log}\,\sigma {S}_{L}﹩ (top right) and ﹩\mathrm{log}\,(\sigma {S}_{L}/{S}_{L})﹩ (bottom right).
Other Images in This Article
Show More
Copyright and Terms & Conditions
© 2026. The Author(s). Published by the American Astronomical Society.
Copyright ©
2026 Astronomy Image Explorer. All Rights Reserved.