Image Details
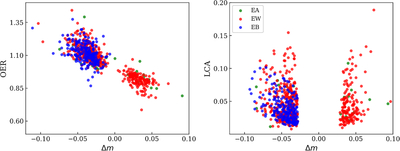
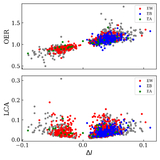
Caption: Figure 6.
Left: Relationship between OER and Δm. EWs exhibit a relatively compact distribution, EBs also display a tight clustering, while EAs are fewer in number and more scattered. Right: Relationship between LCA and Δm. All three types are mainly concentrated in the low-LCA region (<0.1).
Other Images in This Article
Copyright and Terms & Conditions
© 2026. The Author(s). Published by the American Astronomical Society.
Copyright ©
2026 Astronomy Image Explorer. All Rights Reserved.