Image Details
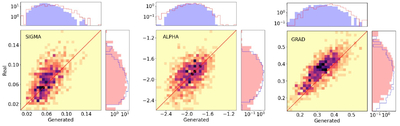
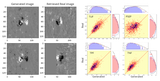
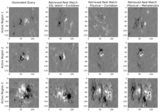
Caption: Figure 9.
Comparison of generated query vs real match related to the distributed image features. The two-dimensional histogram density of the features (SIGMA on the left, ALPHA in the middle, GRAD on the right) are calculated from 1000 randomly generated images and the nearest real neighbors. SIGMA represents the standard deviation of a Gaussian probability density function fitted to the histogram density of image intensity. ALPHA represents the slope of the power law fitted to the radially averaged power spectrum of the image for a given spatial frequency range. GRAD represents the average gradient magnitude of an image. The marginal histograms of generated and matching real-image parameters are plotted in light purple and light pink, respectively. The marginals for generated images are plotted over real and vice versa for comparison in respective colors.
Other Images in This Article
Copyright and Terms & Conditions
© 2026. The Author(s). Published by the American Astronomical Society.