Image Details
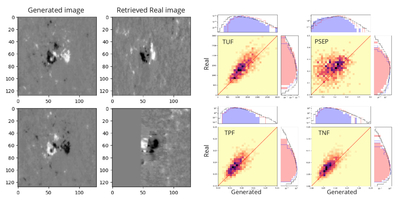
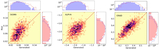
Caption: Figure 7.
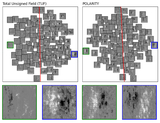
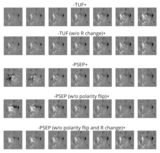
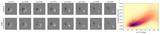
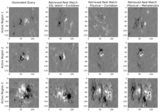
Retrieval and comparison of physical parameters with real nearest neighbors. The leftmost column shows two generated bipolar ARs with opposite polarity. The second column from the left shows the nearest matching real images to the respective generated queries. The third and fourth columns from the left show the two-dimensional histogram density of the four physical parameters (TUF, PSEP, TPF, and TNF) calculated from 1000 randomly generated images and the nearest real neighbors. The marginal histograms of generated and matching real-image parameters are plotted in light purple and light pink, respectively. The black curves overlaid on the marginals represent the histograms of respective physical parameters evaluated across all real images in the dataset. The marginals for generated images are plotted over real and vice versa for comparison in respective colors.
Other Images in This Article
Copyright and Terms & Conditions
© 2026. The Author(s). Published by the American Astronomical Society.