Image Details
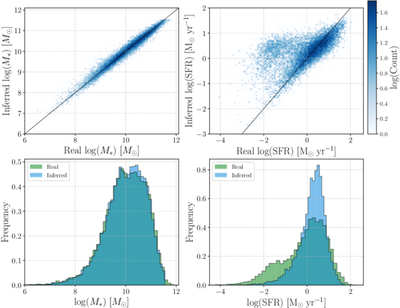
Caption: Figure 4.
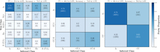
The real vs. predicted values of the stellar mass and SFR for the 16,935 galaxies in the test set with spec-zs. Top row: a heat map of the real vs. predicted distribution of the host-galaxy properties colored by log count. We include a black line with a slope of 1 that goes through the origin to represent where inferences should fall if they were exactly accurate. Bottom row: the normalized histograms of the real and inferred distributions.
Other Images in This Article
Copyright and Terms & Conditions
© 2026. The Author(s). Published by the American Astronomical Society.
Copyright ©
2026 Astronomy Image Explorer. All Rights Reserved.