Image Details
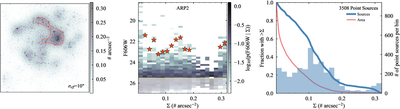
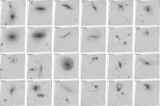
Caption: Figure D1. Summary Point-source Photometry Plots
The complete figure set (216 images) is available in the online journal.
Example of point-source photometry distributions for Arp 2; the full set of 216 plots for the catalog is available online. (Left) The spatial distribution of point sources (points) and the smoothed background density field (gray scale). (Middle) The conditional luminosity function (gray scale) in bins of local surface density, with red stars marking the magnitude of the top 2% of the brightest sources in any density bin with more than 50 stars brighter than F606W = 25.5. (Right) The histogram (shaded blue, right axis) and cumulative distributions (solid lines) of densities calculated at the location of point sources (blue thick line) or pixels (red thin line). Please see Section 2.5 and Figure 12 for a fuller description.
Other Images in This Article
Show More
Copyright and Terms & Conditions
© 2026. The Author(s). Published by the American Astronomical Society.