Image Details
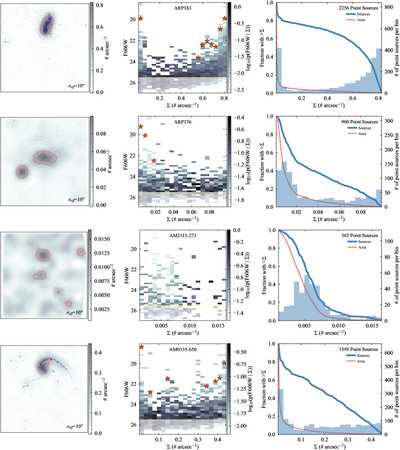
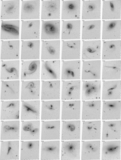
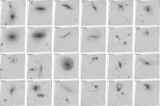
Caption: Figure 12.
Examples of the summary photometry plots found in Appendix D, for a selection of systems with a variety of distances (increasing from top to bottom) and star formation intensities; close-ups of three of these systems are shown in Figure 9, but oriented with north up. The left panels show the location of all point sources (which may be either stars or stellar clusters), plotted on top of a KDE-interpolated density map, with the same orientation as the thumbnails in Figure 4; the red contour is drawn at Σsources,50%, the median surface density of the cataloged point sources. The middle panel shows the density-dependent distribution of point-source magnitudes, normalized to have equal probability density brighter than F606W = 25.5 mag, in each bin of local surface density; filled red stars indicate the magnitude of the top 2% of the brightest sources in any density bin with more than 50 stars brighter than F606W = 25.5 mag. The right panel shows the histogram (in blue) of the local density of all point sources, and its normalized cumulative distribution (thick solid blue line). The thin red line shows the equivalent cumulative distribution of the interpolated density at all pixels in the image; this area-weighted distribution rises sharply at low densities, when the characteristic background level of foreground field stars is reached. Systems with few associated point sources (i.e., no detectable star formation) will have similar cumulative distributions for the red and blue curves (e.g., AM2115-273), and systems with vigorous, highly clustered star formation will have blue curves that depart dramatically from the red curves, particularly at high densities (e.g., Arp 163 and AM0135-650). More distant systems will have fewer point sources at the same SFR, due to biases against detecting fainter, but more numerous, stars and stellar clusters (Figure 8), and biases against detecting individual sources when they are highly crowded and blended together.
Other Images in This Article
Show More
Copyright and Terms & Conditions
© 2026. The Author(s). Published by the American Astronomical Society.
Copyright ©
2026 Astronomy Image Explorer. All Rights Reserved.