Image Details
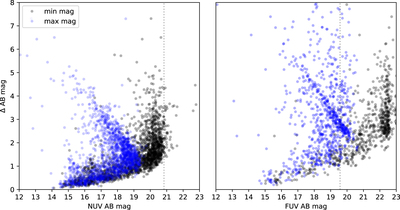
Caption: Figure 2.
The total magnitude change in each lightcurve (Δmag) as a function of the minimum and maximum value in each lightcurve, for both bands. The vertical dotted lines denote 0.5 counts s−1 equivalent magnitudes. This figure gives a sense of the range of source fluxes contained in GFCAT as well as the detection limits for variability (indicated by the offset between the blue and black distributions as a function of magnitude). The detection limit in the NUV is generally consistent with 3σ. (See Million et al. 2016 for an exploration of errors as a function of magnitude.) Note that, while we established 0.5 counts s−1 (indicated by the dotted lines) as a soft cutoff for “detection” in both bands, stars in our sample are generally dimmer in the FUV than NUV. Therefore, many of the variables we detected in the NUV are effectively nondetections in FUV.
Other Images in This Article
Show More
Copyright and Terms & Conditions
© 2023. The Author(s). Published by the American Astronomical Society.